

How Media Professionals Can Test the Waters with Attention in 2026

Ready to put attention at the heart of your media strategy in 2026? Testing attention doesn’t require new teams or tech stacks. It requires curiosity, collaboration, and a willingness to measure what really matters.

For most media professionals, the “attention conversation” has shifted from curiosity to necessity. Over the past few years, attention metrics have moved from experimental dashboards into everyday planning discussions.
Yet for many, 2026 is shaping up to be the year to finally test the waters, to move from theory to proof and to start building an evidence base that shows how attention improves results.
If you’re responsible for planning, buying or optimising media, this article is your practical starting point. Here’s how to introduce attention testing without overhauling your processes and why those early tests could redefine how you measure success.
Why Now: The Case for Starting Small
For decades, the media industry has relied on proxies - viewability, reach, impressions, time-in-view - to gauge ad effectiveness. But these metrics only tell us if an ad was served, not whether it was seen or remembered.
Attention metrics, on the other hand, quantify how real people actually engage with ads. And as Amplified’s global database of 59 billion human attention data points shows, attention predicts outcomes.
- High-attention ads drive up to 7x more impact than low-attention ones
- Active attention seconds correlate strongly with brand recall and conversion lift
- Platforms and formats differ drastically in their ability to hold human attention.
The key takeaway: attention isn’t a new metric, it’s a missing one.
But that doesn’t mean you need a full transformation overnight. 2026 is the year for practical exploration - small, focused tests that prove value and build confidence internally.
Step 1: Start with One Campaign
Begin with a single upcoming campaign, ideally one that’s representative of your core activity (e.g., mid-funnel video, cross-platform display, or paid social).
Use Amplified’s AttentionAI or an attention partner to measure how your creatives perform before going live.
In under 24 hours, you’ll receive:
- An Attention Score benchmarking your ad against the format average
- Second-by-second active vs passive attention analysis
- Insights that will help you strengthen creative and media selection.
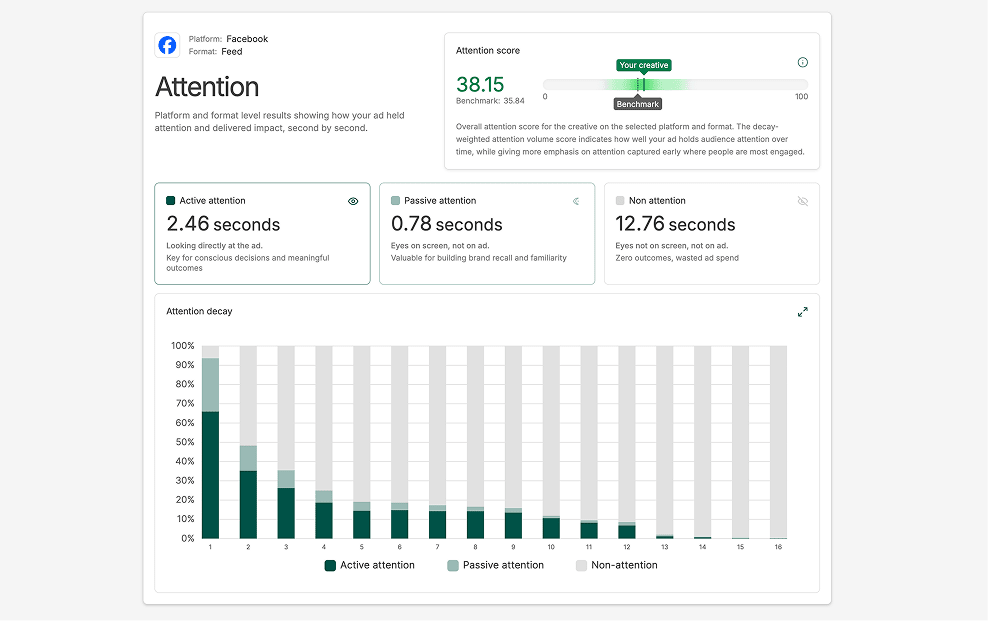
This simple pre-launch test is a low-risk, high-insight way to understand what’s likely to hold attention and where creative or context tweaks could pay off.
Quick Win: Share results internally to demonstrate that attention data is fast, visual and actionable not abstract or academic.
Step 2: Layer Attention Data onto Media Reporting
You don’t need to replace your existing KPIs. Instead, add attention data as a layer to what you already measure.
For example:
- Compare cost per attentive second across formats or partners
- Assess whether high-attention placements also deliver stronger brand lift or conversions
- Reframe performance by reporting “attention-adjusted reach” instead of raw reach.
Over time, you’ll see a pattern emerge: the placements and creatives that hold human attention are the same ones that drive the strongest business outcomes.
Quick Win: Run a side-by-side analysis, same media plan, but evaluate both CPM and aCPM (attentive CPM). It’s an easy way to make the case for quality over quantity.
Step 3: Test Attention Across Platforms
Once you’ve validated attention’s value in one campaign, expand your view.
Run small comparative studies across two or three platforms to see how attention behaves in different environments, e.g - YouTube vs Meta vs CTV.
Look for patterns in:
- Attention duration: How long people stay engaged
- Active vs passive mix: How deeply they process the content
- Attention decay: How quickly focus drops off.
This cross-platform data helps identify which environments are naturally attention-rich, guiding smarter media allocations.
Quick Win: Share a simple bar chart comparing attention seconds per dollar. It’s a clear, visual proof point that instantly resonates with stakeholders.
Step 4: Close the Loop - Link Attention to Outcomes
The next frontier is connecting attention to real business results.
Use past or ongoing campaign data to correlate attention scores with performance metrics such as:
- Click-through rate
- Conversion rate
- Brand lift
- Ad recall or purchase intent
Amplified’s predictive attention models can help you isolate how incremental attention drives incremental outcomes.
Quick Win: Quantify the “attention effect.” Show that a 10% lift in active attention equals a 20–30% lift in conversions or recall. Nothing builds credibility faster.
Step 5: Scale What Works
Once the proof points are visible, attention moves from pilot to process.
Here’s how leading agencies and brands embed attention into standard workflows:
- Use attention-validated creative testing pre-flight
- Integrate attention benchmarks into channel planning
- Optimise bid strategies and inventory selection based on attention efficiency
- Incorporate attention-weighted KPIs in client reporting.
The goal isn’t to replace traditional metrics, it’s to enhance them with human truth.
A Mindset Shift for 2026
Testing attention doesn’t require new teams or tech stacks. It requires curiosity, collaboration, and a willingness to measure what really matters.
For media professionals, this is a rare opportunity: to evolve ahead of the curve, to lead clients with confidence and to make every impression count.
Attention isn’t a passing trend. It’s the connective tissue between media exposure and business results and 2026 is your year to prove it.
So start small. Measure one campaign. Compare results. Share what you learn. The insights you uncover will make “testing the waters” feel more like a competitive advantage.
Bottom Line
Attention is the metric that turns good media into great outcomes. The sooner you test it, the sooner you’ll see why it deserves a permanent place in your planning toolkit.
Learn how global brands and agencies have successfully implement attention strategies with Amplified, or take a look at the Attention Framework from the ARF, CIMM and IAB.
Not all impressions are equal, and reach doesn’t guarantee engagement. Amplified’s Campaign Strategy tools use real human attention metrics to help you predict and optimise media performance before launch.

Your campaign's already live, great. But even the best executions can benefit from a fresh lens. Amplified’s in-flight attention measurement gives you clear, science-backed insights into how your creative and placements are performing while there's still time to level-up results.
Through bespoke research studies, we help brands, agencies and platforms measure attention where it matters most, across TV, social, CTV, DOOH and more. This in-depth research helps you ensure that your media investments are seen, engaged with, and delivering true impact.
Test, refine and optimise with attention-first insights. From creative testing to bespoke data analysis, we help brands, agencies and platforms improve performance.
Amplified offers flexible, API-driven integrations, making it easy to activate real human attention data within your existing platforms and tools. Whether you’re an agency, publisher, platform or brand, our integrations ensure attention insights are directly embedded into your workflow, powering smarter, more effective decision-making.
If you’re looking to take attention beyond a one-off study or standard integration, a partnership with Amplified unlocks exclusive access to research, insights, technology and strategic collaboration that transforms how you measure, plan and execute media.


.webp)
.webp)
.webp)
.webp)
.webp)
.webp)